Show and Tell: Address-Based Infographic
An Inconspicuous Consumption reader used house numbers to chart a formative period of his life. Plus more stick figures, a new Inconspicuous News Roundup, and more!

Show and Tell is an occasional recurring feature of Inconspicuous Consumption, with most of the entries contributed by the site’s readers. Today’s installment is by a reader who prefers to be known simply as Steve. You can see additional Show and Tell posts here. — Paul
By Steve
Paul’s recent post about the artist Yuji Agematsu, who collects little scraps of detritus and arranges them into calendar-based displays, reminded me of a personal project I undertook about 15 years ago.
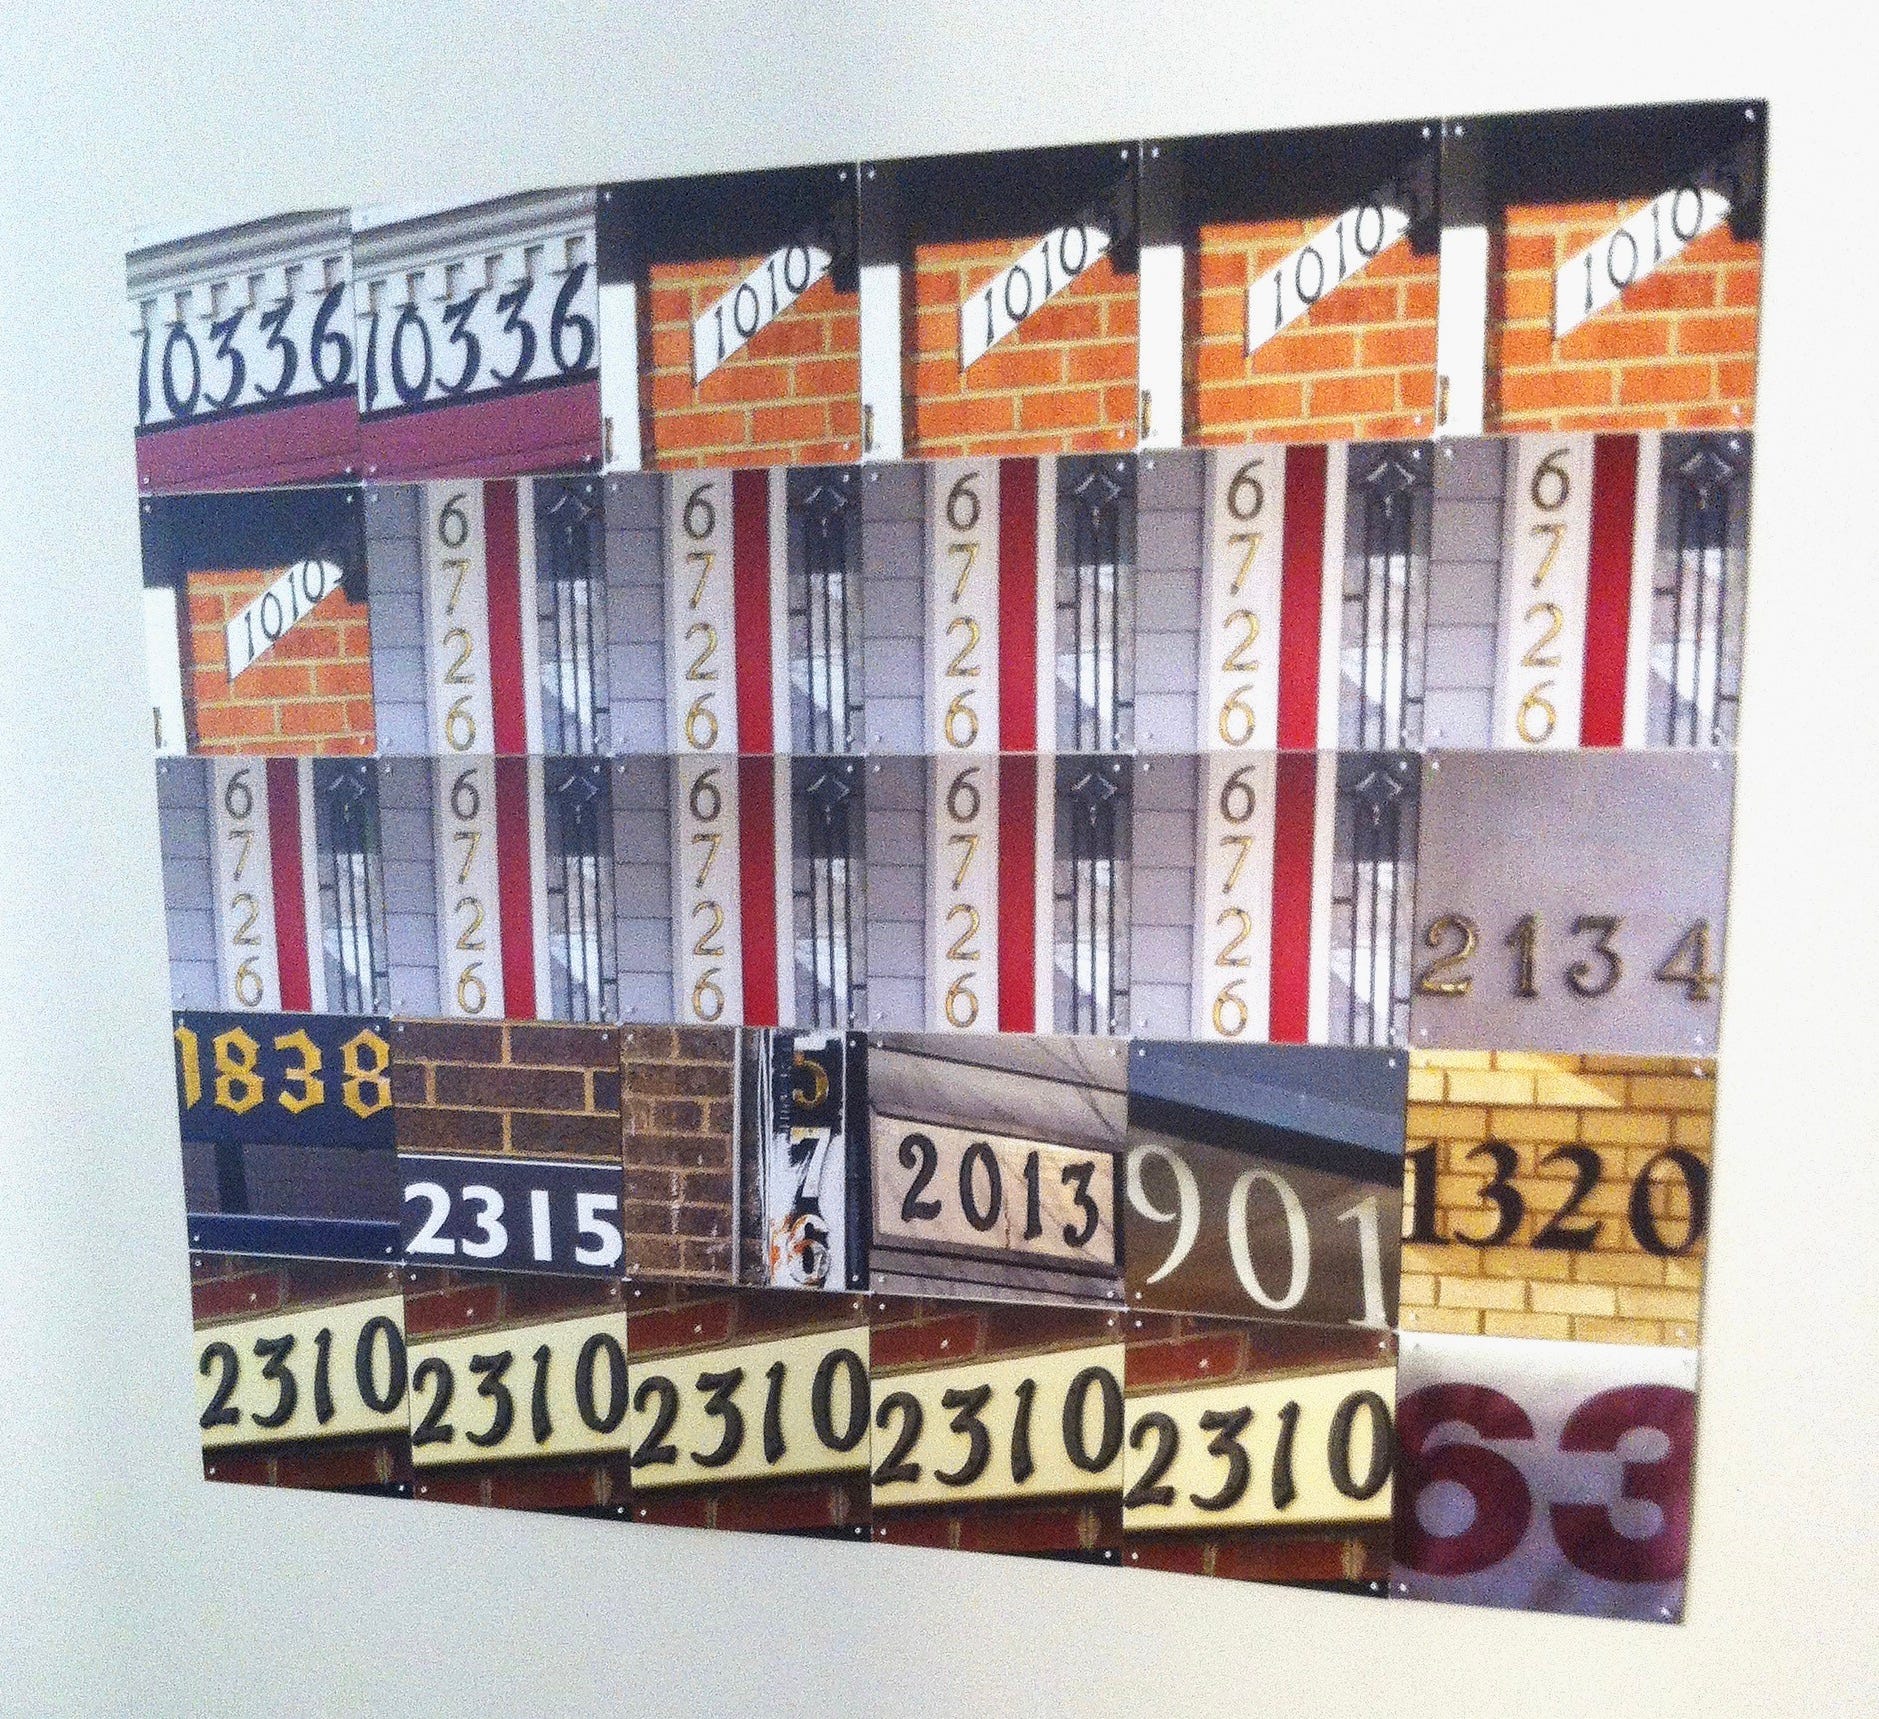
I had just moved into a new apartment in a new city and was about to turn 30. In part because I was thinking about those life transitions of time and place, and in part to scratch some sort of creative itch, I decided to visit all the homes where I’d previously lived (they’re clustered in two separate metropolitan areas that I visited over the course of about a week). I took photos of their house numbers and then used a website that generates photo grids to create a kind of photographic-geographic infographic, with each square representing a year that I lived at a given address — an address-based record of the first 30 years of my life: